Cohort analysis is useful
Cohort analysis is one of the main reports investors look at when doing due diligence. It’s useful for much more beyond that, however. It is an excellent indicator of the evolution of business.
A few tips
-
Cohorts do not have to be monthly. Most often, cohorts are monthly in pitch decks. But you can make them in any period that suits your business. Different teams can also look at different duration cohorts.
-
Cohorts can be further broken down by any attribute. For example, you can compare cohorts of users you signed up, and ones a partner did. Or ones that went through a bootcamp, or by an acquisition strategy. You can also group them by attributes unrelated to their acquisition. For instance, a cohort of suppliers who have a cheese product.
-
Cohorts don’t have to be just for acquisition. They can be for any activity. For instance, you can group users based on when they participated in an event or a training session. You can then compare their performance before and after.
-
Cohorts by acquisition channel can indicate the quality of customers acquired through it. For instance, users acquired through display ads can perform differently from users acquired through a roadshow. The roadshow customers might be much more qualified.
-
Cohort measurement doesn’t just have to be an indicator of activity. It can be nearly any stat, such as the number of purchases or average basket size.
-
Cohorts are fluid. You can influence them after acquisition. If you have a poorly performing large cohort, you can invest in “fixing” it.
-
You can learn from a successful cohort. That means you can take the stats of a successful cohort and see what makes them better.
It becomes useful earlier than you might imagine
In Supplybunny, we have a flexible dashboard that shows stats over time. We didn’t initially focus on cohorts. Only after we had closed funding did we have to start keeping track of cohorts. I just built a cookie-cutter dashboard you find in all the pitch decks. Then I implemented the flexible header that we had already gotten used to. That way, we could segment cohorts into different lengths.
After, I experimented with showing different stats. As a result of this experimentation, we noticed an interesting trend with basket size, for instance.
And you can build it once and use it for a long time
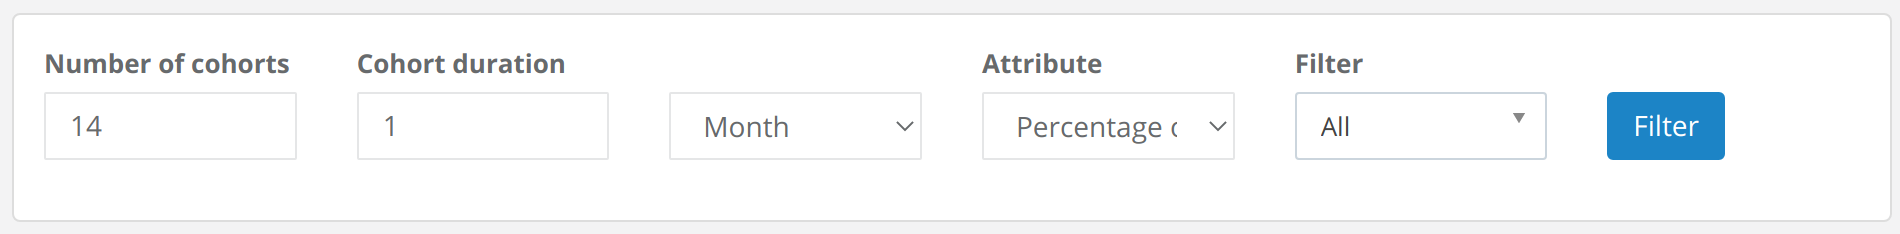
When building the cohorts dashboard, you should have a filtering header that lets the users choose the number of cohorts, their duration, and which stat to show.
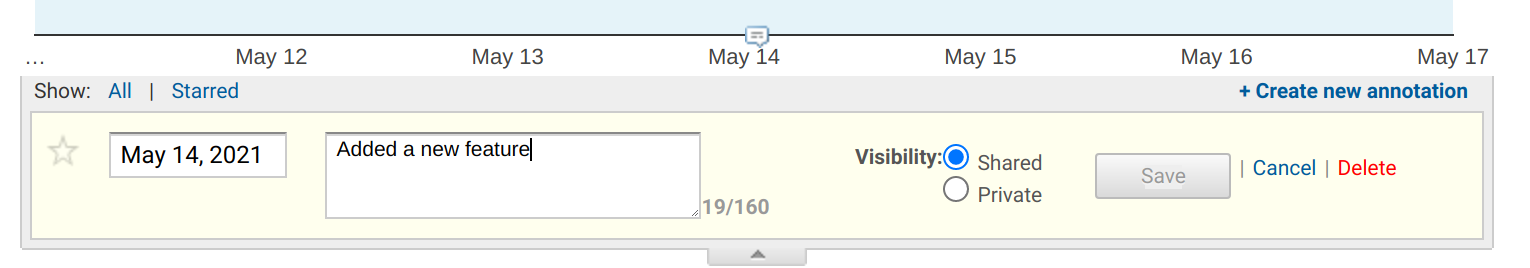
Adding notes to dates so that you can track when changes happened is useful. For instance, when you tried a different acquisition strategy, implemented a new feature, or if there was a public holiday. Google Analytics has this.
It can be further expanded by adding the functionality to split cohorts by arbitrary attributes. You can present it as two cells by having the cohort name as a cell with rowspan=2. It’s also useful to include the overall number as well.
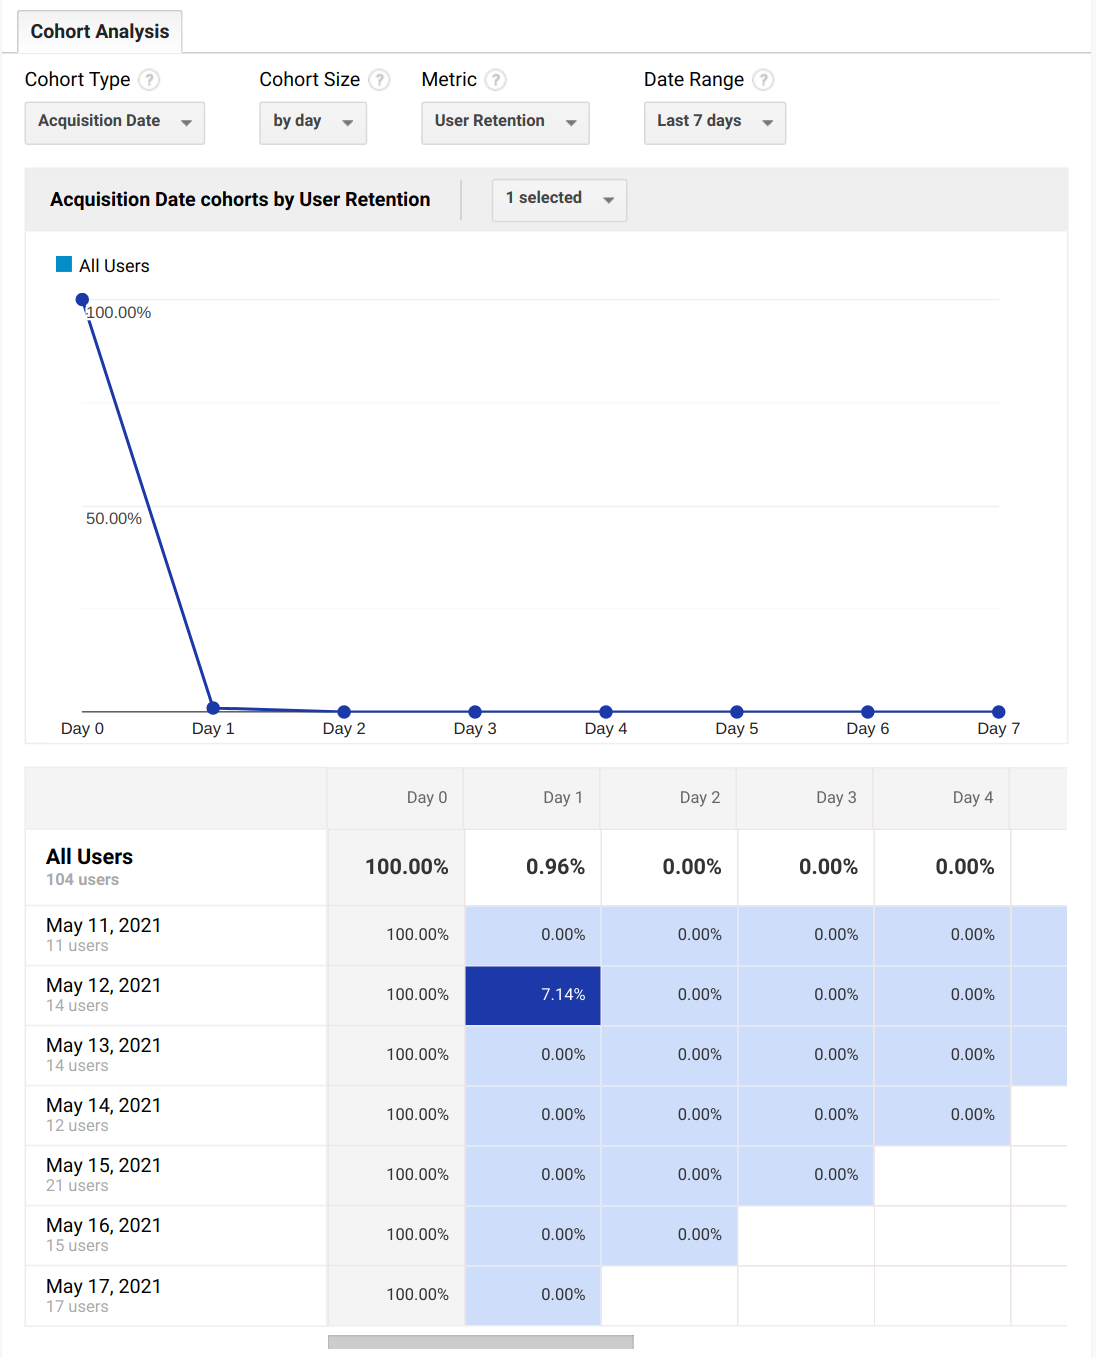
Google Analytics has a pretty good example of the implementation that you can follow but with limited comparison functionality.